Chemistry
3D periodic table
General chemistry · Periodic trends
 Open the interactive 3D model →
Why did Mendeleev’s table predict elements nobody had found yet — and get their properties right?
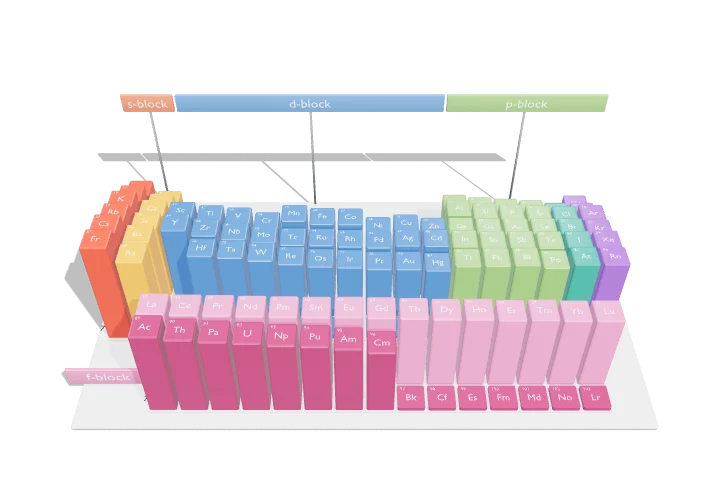
The periodic table lists every element in order of how many protons its atoms have. Elements in the same column have their outer electrons arranged the same way, so they behave alike. In this model each element’s tile rises to show a property, and the patterns appear as hills and valleys.
The periodic table arranges the 118 known elements by atomic number so that elements with the same valence-electron configuration fall in the same column, and its s-, p-, d- and f-blocks mirror the subshells being filled. Plotting atomic radius, electronegativity and first ionisation energy as heights turns the table into landscapes whose slopes are the periodic trends, all explained by effective nuclear charge and shell number.
Key facts
- Elements
- 118 (Z = 1–118), all named; 94 occur naturally on Earth
- Layout
- 7 periods × 18 groups, plus two 15-element f-block rows
- Largest covalent radius
- Fr ≈ 260 pm, Cs 244 pm (Cordero et al. 2008)
- Highest electronegativity
- F, 3.98 (Pauling scale); lowest Cs and Fr ≈ 0.79
- Highest first ionisation energy
- He, 2372 kJ mol⁻¹ (24.59 eV); lowest Cs, 376 kJ mol⁻¹
- Block widths
- s 2, p 6, d 10, f 14 columns = 2(2ℓ + 1)
Parts you can explore (12)
- Hydrogen
- Alkali metals (s-block)
- Alkaline earth metals (s-block)
- Transition metals (d-block)
- Groups 13–16 (p-block)
- Halogens
- Noble gases
- Lanthanides (f-block)
- Actinides (f-block)
- Element symbols
- Block floor plates
- Group & period labels
In the 3D model
Rotate and take apart the model, follow a guided tour of what each part does and why it’s needed, change it with a live slider, and test yourself with a short quiz. Free, no sign-up.
Open 3D periodic table in 3D →
OpenArc Models’ models are simplified teaching schematics. Terms · Privacy